Cause and Effect: What is the Ishikawa Diagram?
Posted by in | Updated

6 minutes to read
The Ishikawa Diagram allows you to represent complex problems in a visual way. Find out how this tool works and how to use it.
It all started with a modest fishbone. It was this unmistakable structure that inspired a Japanese engineer to create a simple way of representing persistent problems – and their multiple causes, sub-causes and sub-sub-causes. It was precisely this complexity, which traditional analytics could not resolve, and the need for prioritization and communication, that drove this practical methodology. Find out what the Ishikawa Diagram is and how it can help solve problems in your organization.
What is the Ishikawa Diagram?
The Ishikawa Diagram is a visual continuous improvement tool that helps identify the causes of a problem. It is also known as a Fishbone Diagram because of its graphical format.
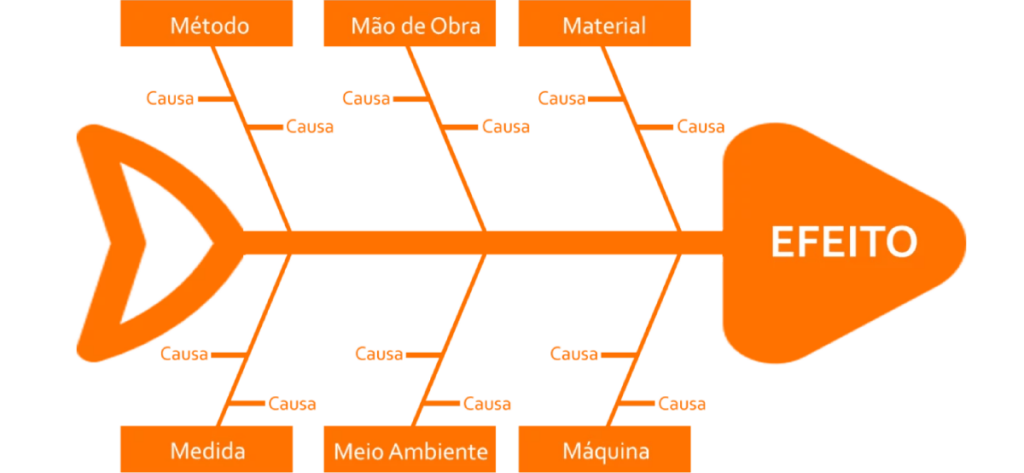
It is filled from right to left, with the problem (the effect) placed at the far right, on the head of the fishbone. From there, the bones irradiate to the left, starting from the major bone that is represented as a horizontal line.
Along that line, six more lines are drawn, three above and three below. These lines represent the major possible types of causes, so that no factor is overlooked:
- Machinery. This category considers the potential causes associated with the incorrect operation of the tools and equipment. Some examples might be outdated programs, malfunctioning or failing servers, or machines with a low throughput.
- Materials. Included here are problems related with raw material. For example, the material may not be compliant to the job requirements or have features that are incompatible with the process.
- Mother Nature. This category encompasses environmental factors that may favor the problem, such as high temperatures, lack of space, poorly optimized layout, or noise.
- Manpower. Problems can occur because of poor allocation of employees or difficulties they may encounter while performing their tasks. Some examples are lack of proper training or control.
- Method. The working methods used during processes may also be contributing to the problem. It is important to consider whether there are documented production processes, if they are the most adequate, and whether they are up to date.
- Measurement. This category covers causes involving the metrics used to evaluate the work. Here, factors such as reliability of calibration instruments, or inadequate production parameters are evaluated.
Despite these categories, the Ishikawa Diagram can be adapted to the reality of each company. It may be necessary to add more “bones” or even remove them, as need be. Inside each of these six categories, also known as 6M, the most important root causes are identified. To do that, the team dealing with the problem on a daily basis should ask, “Why does this problem occur?”, and do so repeatedly until they identify the root cause. Then, simply place that root cause on the Diagram in the most appropriate area.
In the end, for a given problem, it should be possible to identify the Top 10 most critical causes – those that if solved, will cause the problem to stop happening at all, or minimize it significantly.
What are the advantages of the Ishikawa Diagram?
In short, the Ishikawa Diagram allows you to identify, organize, and share the causes of a given problem, defined in different categories, facilitating analysis and resolution. The major advantage is immediate and intuitive display of complex root causes. This makes it easier to navigate the problem, while ensuring that no category is forgotten. The higher the level of detail, the deeper and more complete the understanding of the problem – but don’t overdo it, or you’ll lose the big picture.
The Ishikawa Diagram can be used to analyze problems in processes, work areas, or even a business as a whole, in a more comprehensive way. Because it goes beyond the symptoms and looks for the causes, it makes it easier to find an effective solution. It is also an excellent tool to use with your team in brainstorming sessions where everyone can take part. Also, even after a problem has been solved, the Ishikawa Diagram often exposes other weaknesses that had not yet been foreseen, allowing staff to correct them before they cause more permanent problems.
How to use the Ishikawa Diagram?
Although seemingly very simple, using the Ishikawa Diagram effectively requires some ground rules, especially when it is done as a team – as it should.
- Clearly define the problem to be analyzed (preferably with data).
- Draw a horizontal arrow pointing to the right and add a square at the end.
- Write the problem inside this square.
- Draw diagonal lines around the body of the arrow to contain the 6M (Machines, Materials, Mother-nature, Manpower, Method, and Measurement).
- Gather the team together and brainstorm to define potential causes.
- Enter the causes found, listing them according to severity or importance.
For example, imagine applying the Ishikawa Diagram to a problem of lack of capacity in the washing process, defined by an underwhelming output of “x” trays cleaned per day. Following the methodology, the first step would be to create the Diagram and the 6M. Within the Machine issues, you could record something like high cycle time. In Methods, perhaps the machine loading and unloading process is too long and manual. Under Manpower, you could point out difficulties in operating the machine – and as sub-causes the lack of training of employees. And so on until you fill out the entire picture. After all the factors are listed, it is possible to identify the key causes that are contributing to the problem and promote the appropriate corrective actions.
Somengil, continuous improvement in industrial washing
Continuous improvement is a habit and a way to be at the forefront of your industry. The Ishikawa Diagram is a widely used tool in continuous improvement efforts, but there are many others. Somengil helps companies achieve unprecedented levels of quality through the MultiWasher, an industrial washing machine with high levels of water and electrical efficiency. Very versatile, the MultiWasher washes all kinds of utensils, tools or vehicles, with a design that adapts to the processes and a system that is simple to use. If the root causes you detect in your Ishikawa Diagram need innovative and sustainable solutions, talk to our experts.